An agent that works in a demo and an agent that works reliably in production are two different systems. The gap between them is one of the most expensive lessons teams learn when they start moving agentic systems into real traffic.
The failure usually isn’t dramatic. The agent doesn’t crash. It doesn’t throw errors. It just quietly produces worse output over time — or handles an edge case in a way no test anticipated — or makes seventeen tool calls where three would have sufficed. By the time you notice, real users have been affected, and you have no baseline to know when the degradation started.
This post covers what actually breaks in production agents, why traditional QA misses it, and how to build an evaluation infrastructure that catches failures before they reach users.
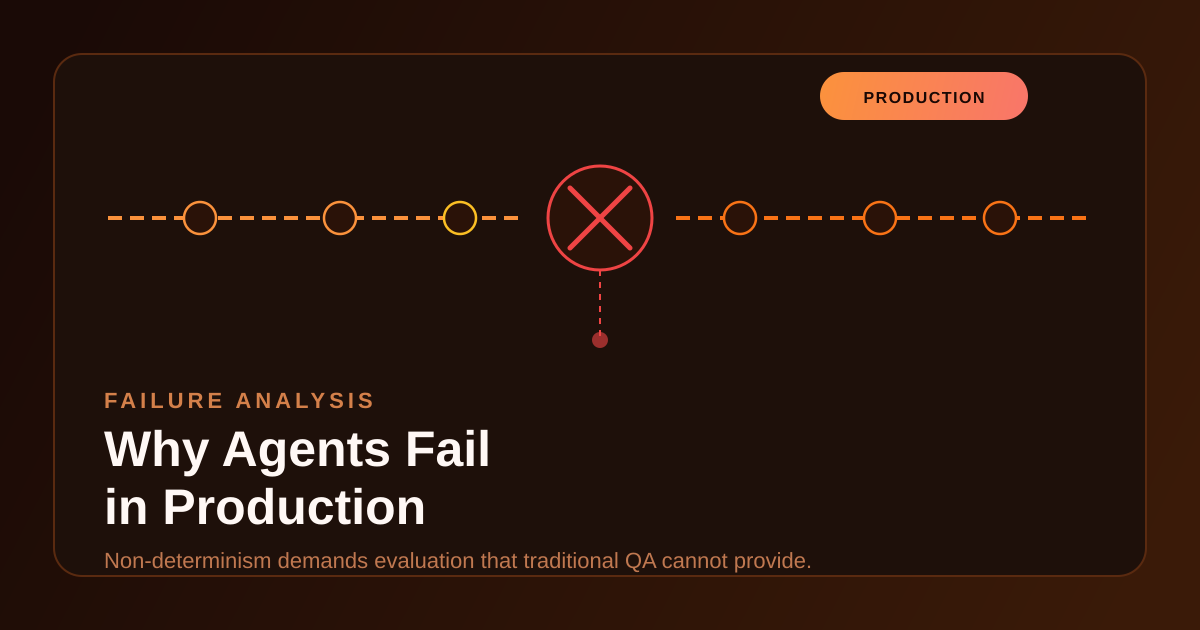
Why Traditional QA Doesn’t Transfer
Traditional software is deterministic. Given input A, it produces output B — every time, on every machine, in every environment. Tests are assertions: given this input, assert this output. If the assertion passes, the code works. If it fails, something is broken.
Agents break this model at the foundation. They’re probabilistic by nature. The same input can produce meaningfully different outputs on different runs — not because something is wrong, but because that’s how the underlying model works. Stochastic sampling, tool call ordering, intermediate reasoning traces — all of it introduces variance that assertion-based testing can’t contain.
More importantly, even when an agent produces the “right” final answer, the path it took to get there may be fragile, expensive, or unreliable on a slightly different input. An agent that solves the problem via an unexpected detour might succeed 90% of the time and silently fail the other 10% — and you’d never know from output-only evaluation.
This means the evaluation strategies that work for deterministic software — unit tests, integration tests, coverage thresholds — are necessary but nowhere near sufficient for agents.
The Production Failure Taxonomy
Before you can detect failures, you need a clear map of what failure actually looks like. Agent failures fall into six categories, and they’re not equally visible:
1. Silent Quality Degradation
The most dangerous failure mode because there’s no error signal. The agent completes the task, returns a result, everything looks normal — but the output quality has drifted. This happens when prompt changes, model version bumps, or tool updates subtly alter behavior in ways that aren’t caught by output-only checks.
Silent degradation is why you need quality metrics running continuously, not just pass/fail gates. Without a baseline, you have no way to know when the line started moving.
2. Trajectory Failure
The agent reaches the correct answer via the wrong path. It uses a slower tool when a faster one was appropriate, makes five calls when two were needed, or retrieves irrelevant context that pollutes its reasoning. The final output looks fine; the execution was wasteful or unreliable.
Trajectory failures are invisible to output-only evaluation but show up immediately in cost and latency metrics — and they often predict future quality failures, because the detour that works today may not work tomorrow.
3. Prompt Sensitivity Failure
Minor input variations produce disproportionately large output differences. An agent that handles “cancel my subscription” correctly but fails on “I want to stop my subscription” has a prompt sensitivity problem. These failures are particularly common after prompt edits, model upgrades, or tool definition changes — any modification that shifts the model’s interpretation of similar inputs.
4. Context Window Mismanagement
Long-running tasks, multi-step workflows, or sessions with heavy tool outputs can fill the context window in ways that weren’t anticipated. When truncation kicks in, the agent loses earlier context — sometimes including the original goal, constraints, or decisions it already made. The result is circular reasoning, repeated tool calls, or abrupt task failure mid-execution. (See how memory layers prevent this for the architectural fix.)
This is especially common in agents that handle file-heavy workloads, long document processing, or multi-turn conversations without explicit context management.
5. Tool Misuse
The agent calls the right tool with wrong parameters, calls the wrong tool for the job, or chains tools in an order that produces a technically valid but semantically wrong result. Tool misuse is particularly hard to catch because the tool calls themselves succeed — there’s no exception — but the output is wrong in a way that depends on understanding the intended semantics.
Tool definition quality directly determines how often this happens. Ambiguous tool descriptions produce ambiguous tool use.
6. Reasoning Drift in Multi-Step Tasks
Over long task sequences, the agent’s reasoning can drift from the original goal. Early decisions compound into later ones; a minor misinterpretation in step 2 propagates through steps 3–8. By the end, the agent has solved a subtly different problem than the one it was given.
Multi-hop reasoning chains and ReAct-style loops are especially vulnerable. Each iteration introduces variance; variance compounds.
What Effective Evaluation Actually Covers
Evaluation that catches these failure modes has three distinct layers, each addressing what the others miss.
Layer 1: Capability Assessment
Does the agent have the fundamental capabilities the task requires? Can it follow complex multi-step instructions? Reason through ambiguous inputs? Use tools correctly in isolation before they’re chained together?
This layer uses structured benchmarks — both standard datasets and task-specific evaluations drawn from your actual production workload. Standard benchmarks tell you where the model lands on the capability curve; production-specific evaluations tell you whether that capability transfers to your specific use case.
The most common mistake here is relying only on general benchmarks and assuming they predict production performance. They don’t. A model that excels on MMLU may still fail systematically on the specific reasoning patterns your application requires.
Layer 2: Trajectory and Tool Use Analysis
This is the layer most teams skip entirely, and it’s the one that catches the failure modes output-only evaluation misses.
Trajectory evaluation compares the actual execution path — the sequence of reasoning steps and tool calls — against an expected reference path. It measures:
- Tool precision: Did the agent call the tools it should have called?
- Tool recall: Did it call all the tools necessary to complete the task correctly?
- Ordering: Did it use them in the right sequence?
- Parameter quality: Were the parameters meaningful and well-formed?
- Call efficiency: Did it minimize unnecessary or redundant calls?
A trajectory that scores high on all five dimensions is a trajectory you can rely on. One that reaches the right answer but fails on efficiency or ordering is a fragile path that may not survive input variation.
Implementing trajectory evaluation means logging every tool call with its full context — what the agent was thinking when it made the call, what it received, what it decided next. Structured traces (OpenTelemetry works well here) make this feasible at scale.
Layer 3: Final Response Evaluation
Output quality assessment — does the final response actually answer the question correctly, completely, and without hallucination?
Two evaluation methods, neither sufficient alone:
LLM-as-judge: Use a capable model (typically a stronger or different model than the agent itself) to rate output quality against defined criteria: correctness, completeness, relevance, tone, and absence of hallucination. Runs at scale, no human bottleneck, catches most obvious failures.
The calibration problem is real: LLM judges can be fooled by confident-sounding but wrong answers, and they tend to favor verbose outputs regardless of actual quality. Mitigate this by testing your judge against a human-rated calibration set, penalizing hedged or vacuous answers explicitly in the rubric, and running adversarial examples the judge is known to struggle with.
Human review: Accurate, catches nuanced failures, expensive to scale. Use human review as a calibration layer for the LLM judge, for high-stakes or ambiguous cases, and for systematic sampling — not as the primary evaluation channel for volume.
The practical approach: human review calibrates the judge; the judge runs at scale; human review audits samples of the judge’s outputs to catch drift in judge quality. This is a loop, not a one-time setup.
The Golden Dataset
The golden dataset is the single most valuable evaluation asset you can build. It is a curated, representative collection of:
- Inputs: Real or realistic task prompts drawn from your production workload distribution
- Expected outputs: Known-good reference answers with acceptable variation ranges
- Expected trajectories: Reference tool call sequences, including ordering and parameter constraints
- Metadata: Task difficulty, failure category risk, coverage tags
Every CI/CD pipeline runs against the golden dataset before any change — to code, prompts, tool definitions, or model versions — reaches production. A change that degrades golden dataset performance doesn’t ship.
How to build it:
Start with 50–100 examples covering your most common task types and known edge cases. Prioritize diversity over volume: a dataset of 100 well-chosen, well-annotated examples is more valuable than 1,000 examples clustered around a single pattern.
Annotate trajectories explicitly. For each example, define which tools should be called, in what order, with what parameter constraints. This is time-consuming. Do it anyway. Trajectory annotations are what make the dataset capable of catching the failures output annotation misses.
Set tiered pass/fail thresholds. Different task types have different quality tolerances. A customer support agent might require 95% output accuracy; a research assistant might tolerate more variance. Define thresholds by tier before deployment — not after the first production failure.
How to grow it:
Every production failure that reaches users is a test case the golden dataset should have contained. The process for adding it is: root cause the failure, create the example, annotate it, add it to the dataset, confirm the evaluation pipeline catches it, then ship the fix.
This transforms every production incident into a permanent regression test. Teams that run this process consistently see incident recurrence rates drop significantly within the first few months.
The Evaluation Pipeline Architecture
The evaluation infrastructure that runs this in practice looks like this:
Code / Prompt / Tool change
         │
         ▼
┌─────────────────────────────────┐
│      Pre-merge evaluation       │
│  Golden dataset (capability +   │
│  trajectory + response quality) │
│  Pass/fail gate                 │
└──────────────┬──────────────────┘
               │ passes
               ▼
┌─────────────────────────────────┐
│       Staging evaluation        │
│  Full workload replay on        │
│  recent production traffic      │
│  sample. LLM-as-judge scoring.  │
└──────────────┬──────────────────┘
               │ passes
               ▼
┌─────────────────────────────────┐
│     Canary deployment           │
│  Live traffic slice (5–10%).    │
│  Real-time quality metrics.     │
│  Human review sampling.         │
│  Automatic rollback on          │
│  quality threshold breach.      │
└──────────────┬──────────────────┘
               │ stable
               ▼
         Full production
Each stage narrows the blast radius of a failure. Pre-merge catches regressions before they’re reviewed. Staging catches distribution shift that the golden dataset missed. Canary limits exposure before full rollout and provides automatic rollback if metrics degrade.
The canary stage is where real-time quality monitoring matters most. The metrics to watch:
- Task completion rate: Did the agent finish the task, or did it abort, time out, or loop?
- Tool call efficiency: Average calls per task vs. baseline. A sudden increase signals trajectory degradation.
- Response quality score: LLM-judge scores on a rolling window. Set alert thresholds, not just manual checks.
- Latency p50/p95: Trajectory failures show up as latency spikes before they show up as quality failures.
- Cost per task: Unnecessary tool calls inflate cost before they necessarily degrade output.
Alerts on these metrics are your canary in the canary deployment. By the time a quality failure is visible in user feedback, it’s been running for hours. Metric alerts catch it in minutes.
The Feedback Loop
The evaluation infrastructure described above is a gate. The feedback loop is what turns it into a compounding advantage.
The loop has four steps:
- Production monitoring surfaces a failure — anomaly in quality metrics, user report, sampling catch.
- Root cause analysis — trace the failure back to a specific decision in the execution path. Was it a tool call? A reasoning step? A context window overflow? The trace you captured during execution is what makes this fast.
- Golden dataset update — add the failing case as a new annotated example. Confirm the evaluation pipeline catches it.
- Fix and validate — implement the fix, verify it passes the new test, ship.
Each cycle through the loop tightens the evaluation coverage and reduces the probability of the same failure class recurring. After six months of consistently running this process, teams typically have evaluation coverage that would have caught the majority of the failures they experienced in the first month.
The metric that matters here is time-to-detect: how long between when a quality regression is introduced and when the evaluation pipeline catches it. Teams without a feedback loop measure this in weeks. Teams with a mature loop measure it in minutes — at the pre-merge stage, before the regression is ever deployed.
The Evaluation Anti-Patterns
A few patterns that look like evaluation infrastructure but don’t actually protect you:
Output-only evaluation with no trajectory checks. This misses tool misuse, reasoning drift, and efficiency failures entirely. You’re testing whether the agent eventually reaches a good answer, not whether it’s reliable.
A golden dataset that never grows. A static dataset becomes less representative over time as your production distribution shifts. If you haven’t added examples in three months, your coverage is drifting from your actual workload.
LLM-as-judge without calibration. An uncalibrated judge may have systematic biases (length preference, confidence preference) that cause it to pass outputs it should fail. Calibrate against a human-rated set and audit judge outputs regularly.
Evaluation that only runs before production. Without continuous quality monitoring in production, you have no signal on silent degradation. Pre-deployment gates catch regressions introduced by changes; continuous monitoring catches degradation caused by input distribution shift, external API behavior changes, or model serving infrastructure issues.
No defined rollback criteria. If you don’t know what metric threshold triggers a rollback before you deploy, you’ll make that decision under pressure after something has already gone wrong.
What to Build First
If you’re starting from zero, the order matters:
First: Instrument your agent to log structured traces — every tool call, every reasoning step, latency, cost. You can’t evaluate what you can’t observe, and you can’t root cause failures without traces. This takes a day or two and unblocks everything else.
Second: Build a golden dataset of 50–100 examples with output and trajectory annotations. Do this before the first production deployment, not after. Without a baseline, you have no way to know when quality starts drifting.
Third: Wire the golden dataset into your CI/CD pipeline. Every pull request runs the evaluation suite; failing the suite blocks the merge. This is the gate that prevents regressions from shipping.
Fourth: Add a staging replay stage that runs recent production traffic samples through the updated agent before full deployment. This catches distribution shift that your golden dataset doesn’t cover.
Fifth: Add production monitoring with alert thresholds on the key quality metrics. Canary deployments with automatic rollback on threshold breach.
The feedback loop — converting production failures into golden dataset entries — starts running from day one. It’s a process, not a system. The discipline of doing it consistently is what compounds.
The Cost of Skipping This
Teams that skip evaluation infrastructure usually discover its value the same way: a production failure that takes longer to diagnose than it should, because there are no traces to follow and no baseline to compare against.
The cost isn’t just the incident itself. It’s the manual investigation that could have been automated. It’s the regression that ships twice because the first fix didn’t have a test. It’s the model upgrade that degrades quality in a way nobody catches for three weeks because there’s no continuous monitoring.
Evaluation infrastructure for agents is not overhead. It’s the mechanism that makes deployment confidence possible — and deployment confidence is what separates teams that can iterate in hours from teams that spend weeks manually validating changes before they’ll ship.
Part of the AI Agents in Production series.